 Service

Tissot Indicatrix
Feb 6,2026
GISBox is a one-stop 3D GIS data editing, conversion and publishing platform that supports editing in multiple GIS formats such as OSGB/GEOTIFF/RVT, converting to 3DTiles/Terrain and publishing.
Introduction
Tissot Indicatrix is a classical method in cartography used to quantify and visualize distortions inherent in map projections. Developed by French mathematician Nicolas Auguste Tissot in the 19th century, it provides a precise geometric tool for analyzing how angles, areas, and shapes are deformed when transferring locations from the Earth's surface to a map. Rather than representing a projection itself, the indicatrix consists of plotting infinitesimal circles onto a projection grid to demonstrate how they become ellipses or other shapes under different projection transformations. This method enables an intuitive and scientific comparison of projection properties and remains foundational for evaluating projection suitability across mapping, geomatics, and geographic education.
Projection Basic
The Tissot Indicatrix operates on the principle that any infinitely small circle drawn on a spherical or ellipsoidal model of the Earth transforms into an ellipse when projected onto a map surface. The ellipse axes—semiaxis aa in the direction of maximum scale increase and semiaxis bb in the direction of minimum scale—characterize distortion properties mathematically:
- Angle distortion is quantified by the difference between the ellipse's axes orientation and the original circle’s orthogonal axes.
- Area distortion is measured by the product a×ba×b relative to the original unit circle’s area.
- Scale distortion varies across the map, represented visually by varying ellipse size and eccentricity.
Each ellipse is plotted at a regular geographic interval (e.g., graticule intersections), collectively forming a deformation grid that illustrates the projection's spatial variability in distortion. This method applies to all projection types—conformal, equal-area, or compromise—making it a universal diagnostic tool.
Pros
- Comprehensive Distortion Visualization: Enables clear, simultaneous representation of angular, areal, and linear distortion patterns across the entire map, surpassing single‑metric analyses.
- Standardized Quantitative Comparison: Provides a universally recognized framework to objectively evaluate and compare different map projections, supporting informed selection for specific use cases.
- Intuitive Educational Utility: Makes abstract distortion concepts accessible through visual ellipses, helping students and professionals understand trade‑offs in projection design.
- Adaptable Across Projections: Applicable to any projection—from cylindrical to azimuthal—and can be implemented in both spherical and ellipsoidal coordinate models.
Cons
- Discrete Sampling Limitation: Only visualizes distortion at discrete sample points (ellipse centers), potentially missing localized distortion variations between plotted points.
- Interpretation Requires Expertise: Ellipse geometry (size, shape, orientation) demands cartographic knowledge to translate into meaningful distortion characteristics for map users.
- Visual Clutter in Dense Layouts: Overplotting ellipses at high sampling densities can obscure underlying map details, reducing overall readability.
- Computational Overhead for Dynamic Mapping: Generating high‑resolution Tissot grids in real‑time web mapping or interactive visualization systems may increase processing demands.
Application Scenario
The Tissot Indicatrix is primarily employed in cartographic education, evaluation, and selection of map projections, providing visual guidance for the accurate rendering of various thematic maps. In cartographic pedagogy, this method translates abstract projection distortion theory into intuitive elliptical diagrams, helping students understand the mathematical balance among conformal, equal-area, and compromise projections. Within the GIS profession, it aids map designers in selecting the most suitable projection based on regional geographic characteristics (such as polar, equatorial, or obliquely elongated zones) and validates distortion distributions in custom or regional projections. In digital mapping platform development, this tool can also be integrated into interactive projection comparison modules, enabling users to observe real-time patterns of angular, areal, and shape distortions across different projections. Its core value lies in transforming complex mathematical distortions into quantifiable, comparable visual language, making it a critical bridge between projection theory and mapping practice.
Example
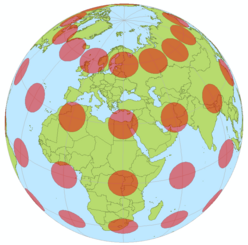
1. Equal-size circles on the surface of the globe
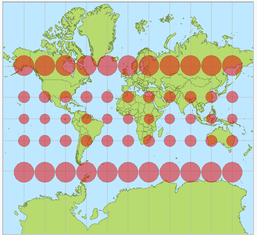
2. The Mercator projection with Tissot's indicatrices.
Related GIS Projections
Vertical Near-side Perspective Projection
Two-point Equidistant Projection
References
- https://en.wikipedia.org/wiki/Tissot%27s_indicatrix
- https://www.esri.com/arcgis-blog/products/arcgis/mapping/tissots-indicatrix-helps-illustrate-map-projection-distortion
- https://map-projections.net/tissot.php