Service

Mapillary Vector Tiles API
Nov 5,2025
GISBox is a one-stop 3D GIS data editing, conversion and publishing platform that supports editing in multiple GIS formats such as OSGB/GEOTIFF/RVT, converting to 3DTiles/Terrain and publishing.
Introduction
Mapillary Vector Tiles API is an interface that provides structured vector map data, providing developers with the geographic locations and attributes of real-world objects (e.g., road markings, traffic signs, lanes, and road shapes) collected by the Mapillary platform in the form of efficiently transportable "tiles." Developers can use this highly accurate vector data to build applications such as augmented reality (AR) navigation, detailed map analysis, and infrastructure management tools.
File Structure
The file structure of the Mapillary Vector Tiles API is designed based on the vector tile technical specification and mainly consists of the following elements:
1. Tile hierarchy: Following the standard TMS/XYZ standard, the Earth's surface is divided into 256x256 pixel square tiles for each zoom level.
2. Layer definition: Each tile contains multiple layers that classify and store different geographic elements.
3. Feature and geometry data: The core of a vector tile is the feature, and each feature contains geometric shapes such as points, lines, and areas, as well as attribute data. Coordinates are stored efficiently using delta encoding, and attributes are stored as key-value pairs, supporting interaction and filtering at the element level.
4. Metadata extensions: The tile header contains metadata such as a version number, coordinate system (usually Web Mercator), and tile boundary extents. Depending on the implementation, custom metadata such as data source and processing timestamps may be added.
5. Dynamic Style Support: Unlike raster tiles, vector tiles have a structure that allows styling rules to be applied dynamically on the client side. Styles are bound to attributes, allowing visualization of multiple themes in the same tile.
Pros
1. Deep integration with Street View: The greatest strength of the Mapillary API is its ability to directly link Street View imagery contributed by users around the world with vector tile layers.
2. Real-time update mechanism: The vector tile service adopts a community-contributed data update model, allowing it to quickly reflect changes in the real world. According to the official documentation, updates are made every few hours in some areas, far more frequently than traditional map services (weekly or monthly).
3. Flexible client-side styling: It complies with the Mapbox Vector Tile standard, allowing layer styles to be changed dynamically on the client.
Cons
1. Regional bias in data: Due to its reliance on community contributions, data distribution is subject to regional bias.
2. Restrictions on commercial use: The free API has strict usage limits (e.g., 500,000 requests per month), and anything beyond that requires an enterprise license agreement.
3. High technical complexity: Developers must simultaneously handle vector tiles and image data streams and build logic to associate elements with images.
Application Scenario
The application areas of the Mapillary Vector Tiles API are focused on vertical applications that combine Street View and vector data. Typical examples include smart city management, transportation infrastructure inspection, autonomous driving testing, and AR navigation. The ability to link Street View with vector elements allows, for example, clicking on a road element to automatically display a streetscape image of the corresponding location, offering significant advantages in traffic management and urban infrastructure inspection. Furthermore, the real-time update mechanism allows the API to instantly reflect changes in the real world, making it suitable for fields that require dynamic data, such as disaster response and real-time navigation. Furthermore, flexible client-side styling makes it easy to create custom visualizations for specific industries.
Example
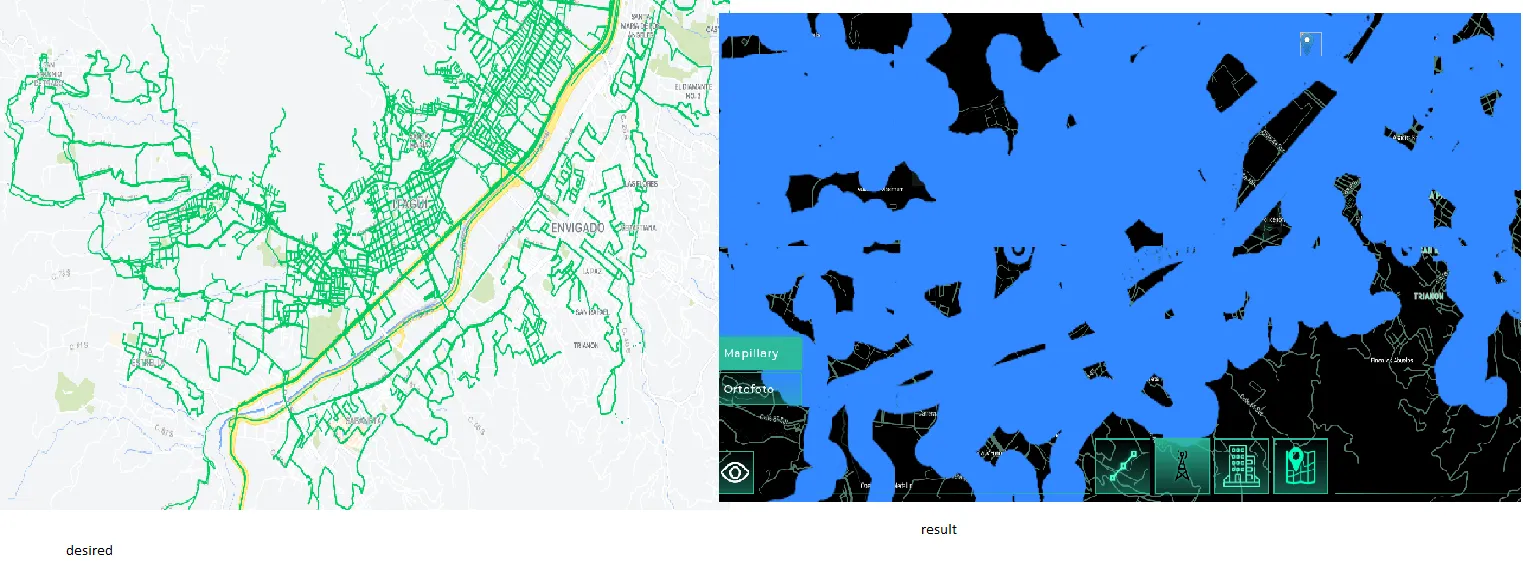
1. An example of a custom map displayed on the web using MapTiler.
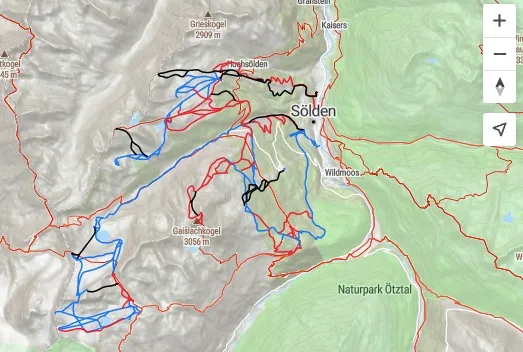
2. An example of integrated display using the Vector Tile API and Leaflet.VectorGrid.
File Opening Mode
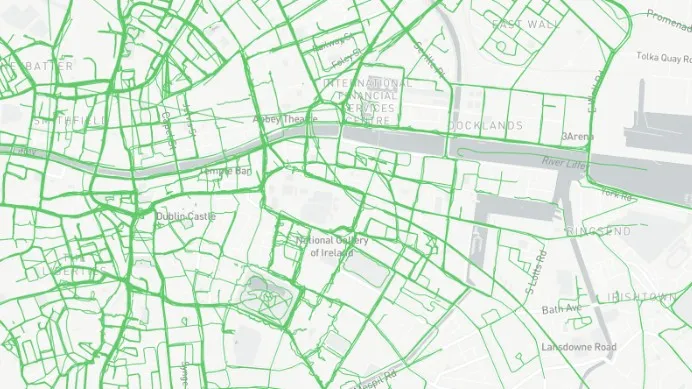
1. Use vector maps to visualize image coverage in Dublin city center.