Service

Mercator Projection
Nov 24,2025
GISBox is a one-stop 3D GIS data editing, conversion and publishing platform that supports editing in multiple GIS formats such as OSGB/GEOTIFF/RVT, converting to 3DTiles/Terrain and publishing.
Introduction
Mercator projection is a conformal tangent cylindrical projection devised by the Flemish cartographer Gerardus Mercator in 1569. It conceptually projects the Earth's surface onto a cylinder tangent at the equator, with a light source at the Earth's center casting surface features onto the cylinder. When unrolled, this creates a world map with the standard parallel at zero degrees (the equator).
Coordinate System Composition
- Origin Definition: The intersection of the Equator and the Prime Meridian (0° longitude) serves as the coordinate origin, with east and north as positive directions, west and south as negative directions.
- Axis Orientation: The X-axis represents longitude, ranging from [-20037508.34, 20037508.34] meters. The Y-axis represents latitude, theoretically infinite near the poles but practically constrained to the same range as the X-axis: [-20037508.34, 20037508.34] meters.
- Projection Limits: Due to its mathematical properties, areas beyond approximately ±85.0511° latitude cannot be fully represented, causing polar regions to be truncated. The global coordinate extent is bounded between (-20037508.34, -20037508.34) and (20037508.34, 20037508.34).
Pros
- Direction and Angle Preservation: As a conformal projection, it maintains local angles and shapes, rendering rhumb lines (lines of constant bearing) as straight lines. This facilitates straight-line course planning in maritime and aerial navigation.
- Navigation Convenience: Meridians and parallels intersect at right angles everywhere, enabling accurate bearing measurements between any two points. Ideal for nautical charts and aeronautical maps.
- Web Mapping Compatibility: The Web Mercator variant (e.g., used by Google Maps) serves as the standard for online mapping services due to its uniformity and ease of display, supporting global map visualization.
Cons
- Area and Distance Distortion: Severe area exaggeration occurs at high latitudes; for instance, Greenland appears 14 times larger than its actual size, with polar scale factors approaching infinity.
- Polar Region Limitations: The poles cannot be displayed completely, and length/area distortions increase progressively toward the poles.
- Thematic Mapping Constraints: Unsuitable for thematic maps requiring accurate area representation (e.g., population density, resource distribution) due to shape distortion. Equal-area projections (e.g., Gall-Peters) are preferable for such purposes.
Application Scenario
The Mercator projection is extensively used in maritime navigation for charting, where its preservation of rhumb lines as straight lines simplifies course calculation and route planning. In aviation, it enables straight-line airway design leveraging its conformal properties. Additionally, Web Mercator has become the standard for online map services (e.g., Google Maps, OpenStreetMap), ensuring correct shapes and orientations while facilitating map tiling and rapid loading due to its parallel grid. However, significant area distortion at high latitudes makes it unsuitable for polar mapping or thematic applications requiring precise areal representation.
Example
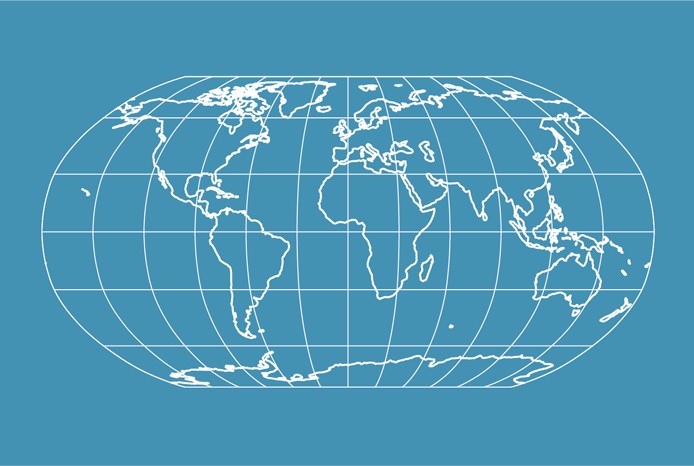
1. Robinson projection.
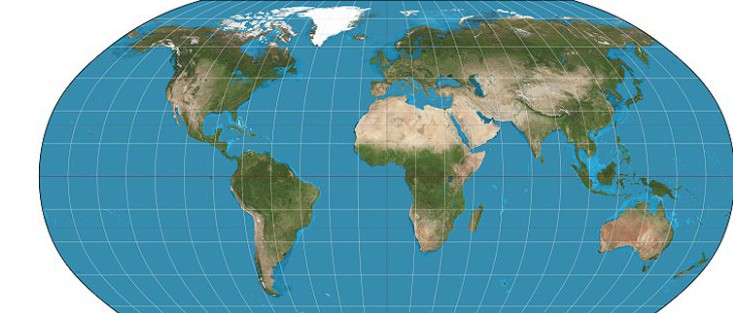
2. Robinson projection.