Service

Carto Tiles API
Nov 24,2025
GISBox is a one-stop 3D GIS data editing, conversion and publishing platform that supports editing in multiple GIS formats such as OSGB/GEOTIFF/RVT, converting to 3DTiles/Terrain and publishing.
Introduction
CARTO Tiles API is an interface provided by the CARTO platform for efficiently processing and visualizing geospatial data. By splitting large datasets into pre-rendered tiles, it optimizes map loading speed and browsing experience, supporting various tile types such as dynamic and aggregated tiles. Built on the OGC API-Tiles standard, it integrates with CARTO’s declarative language, deck.gl, enabling flexible map styling and interactive application development.
File Structure
The file structure of the CARTO Tiles API primarily includes the following core components:
- Tile Endpoints: Used to directly request vector tile data in MVT format.
- Metadata Endpoints: Retrieve metadata of tile sets (in JSON format), including data extent, attribute fields, and coordinate systems.
- Style Configuration: Style files (typically in JSON), independent of the API, define tile visualization rules such as colors and labels.
- SQL Query Endpoints: Dynamically generate tiles by processing data in real time through SQL queries.
- Static Resources: Auxiliary resources like icons and fonts used for map rendering.
Pros
- High-Performance Visualization: Pre-rendered tiles (e.g., dynamic tiles, aggregated tiles) optimize map loading by rendering only tiles within the current viewport, significantly improving response speed and bandwidth efficiency. This makes it particularly suitable for handling large-scale spatial data.
- Flexible Data Integration: Compatible with multiple data formats (e.g., GeoJSON, Shapefile) and supports direct connections to cloud data warehouses (e.g., BigQuery, Snowflake). Tiles can be dynamically generated via the Analytics Toolbox’s SQL modules (e.g., tiler) without external preprocessing.
- Developer-Friendly: Offers a complete development workflow, supporting CartoCSS and JavaScript libraries (e.g., CartoJS), and integrates with frameworks like deck.gl for building advanced vector rendering and interactive map applications.
- Multi-Type Tile Support: Includes dynamic tiles (real-time processing), simple tiles (static data), aggregated tiles (data aggregation), and spatial index tiles (fast retrieval), catering to diverse scenario needs.
Cons
- High Cost: Enterprise-level API usage is expensive, which may be prohibitive for startups or small teams. Additionally, some legacy features are no longer maintained, requiring migration to new architectures.
- Learning Curve and Configuration Complexity: Requires defining styles and interactive logic via MapConfig files, posing challenges for beginners. Accessing private data necessitates API Key configuration, adding deployment complexity.
- Client-Side Rendering Limitations: Compared to Mapbox Vector Tiles, style customization relies more on server-side configuration, limiting client-side flexibility and real-time interactivity.
Application Scenario
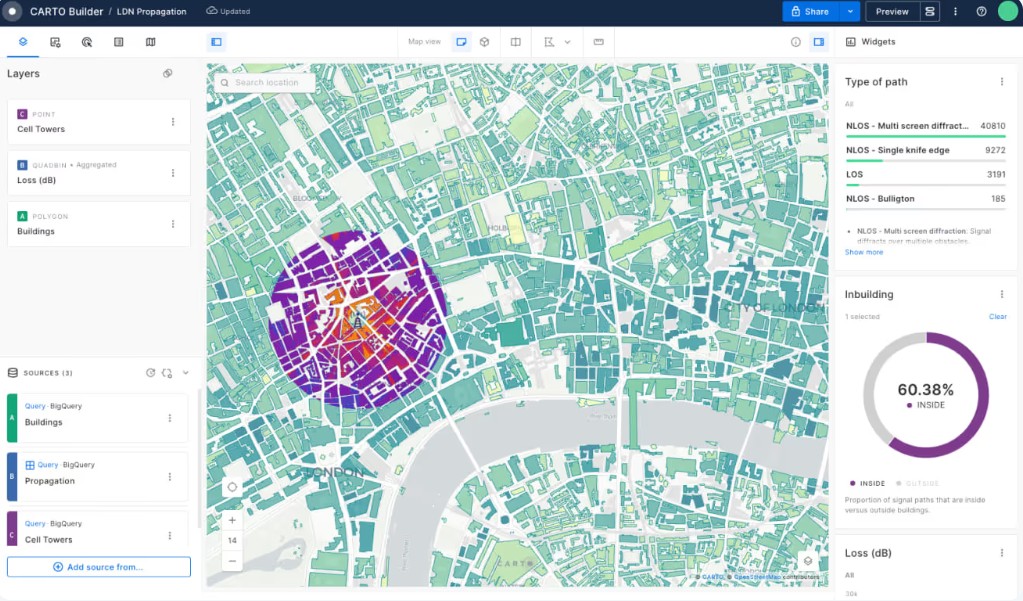
The CARTO Tiles API is widely used in various geospatial data visualization scenarios. Its core value lies in optimizing the interactive experience of large-scale data through pre-rendered tile technology. In urban planning, it visualizes infrastructure distribution, population density, or land-use changes, helping decision-makers analyze urban expansion trends. In business intelligence, enterprises use the API to display store locations, customer heatmaps, or logistics networks, such as dynamically rendering sales data with CartoCSS to optimize regional strategies. For environmental monitoring, it integrates real-time sensor data (e.g., air quality, vegetation coverage) to generate interactive ecological maps, supporting climate change research. In traffic management systems, its vector tile technology efficiently renders real-time road conditions, accident points, or public transport routes, enhancing the responsiveness of navigation applications. Furthermore, CARTO’s integration with the Analytics Toolbox enables direct generation of aggregated tiles in data warehouses (e.g., BigQuery), making it suitable for complex scenarios like financial risk analysis or public health event tracking.
Example
1. Use MVT to dynamically render data transformed and analyzed using PostGIS.
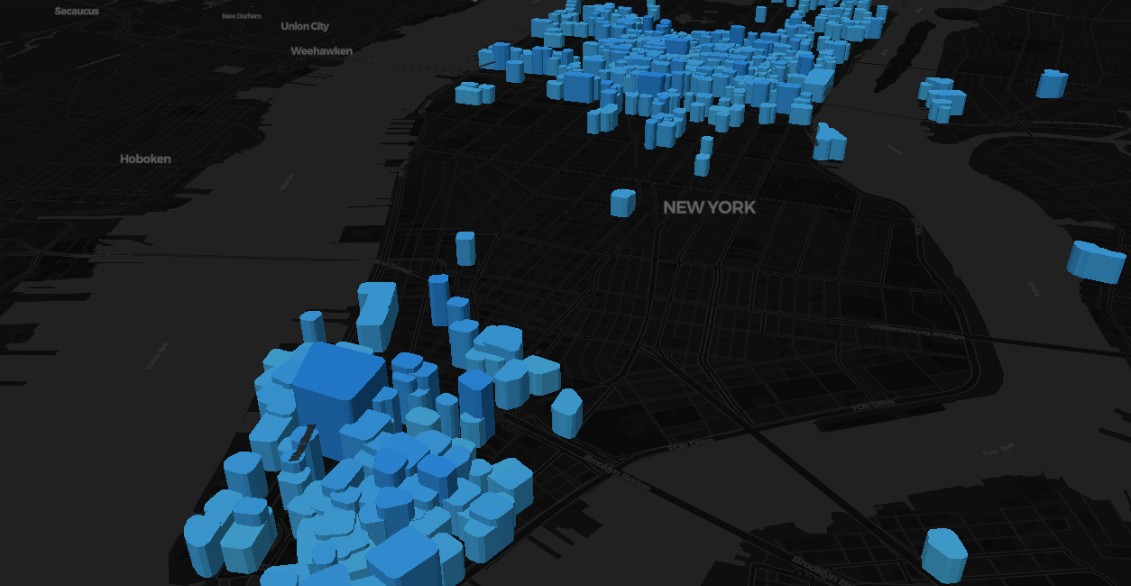
2. Build location-smart applications.
File Opening Mode
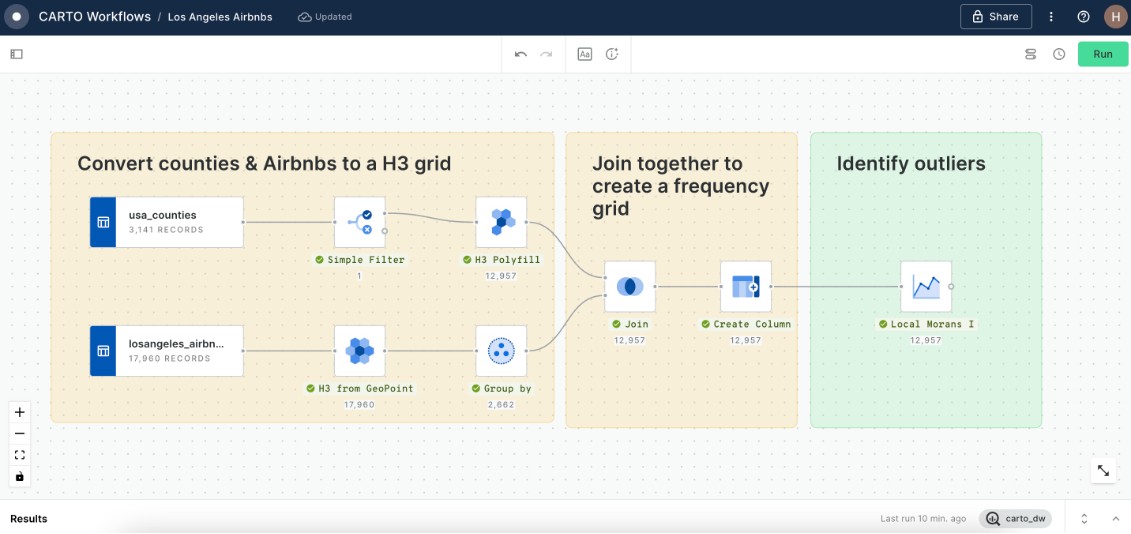
1. CARTO Workflows runs some analyses.